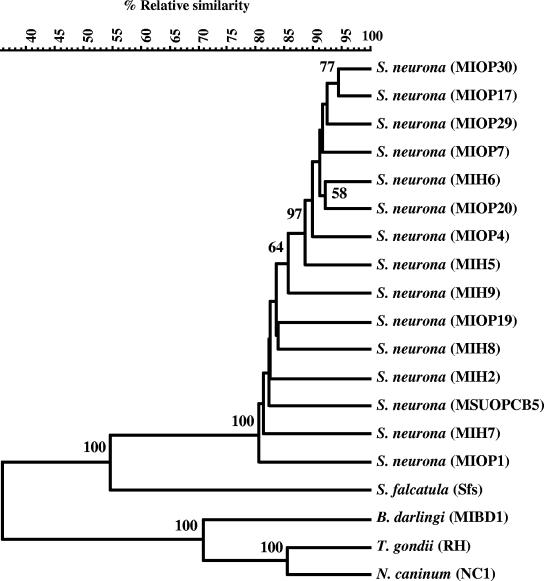
FIG. 1.
UPGMA dendrogram based on AFLP markers obtained with nine primer pairs. Numbers shown at different nodes represent percent confidence limits obtained in the bootstrap analysis. Nodes without numbers had bootstrap values of less than 50. The scale shown above is the measure of genetic similarity calculated according to the Jaccard similarity coefficient prepared from AFLP banding patterns of 15 S. neurona isolates. Taxon names and designations are indicated on the right side of the panel.

