Figure 6.
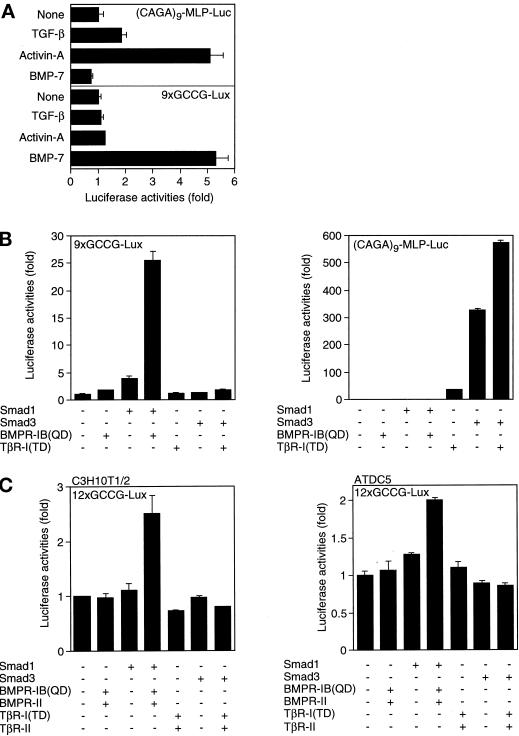
Response specificity of the GCCG motif. (A) The responses of (CAGA)9-MLP-Luc and 9xGCCG-Lux to various ligands were compared in P19 cells. Ten ng/ml TGF-β, 100 ng/ml activin, and 1000 ng/ml BMP-7 were used. The values represent fold induction as determined by comparing with the basal activity of each reporter. (B) The responses of (CAGA)9-MLP-Luc (right panel) and 9xGCCG-Lux (left panel) to Smad1 or Smad3 were compared in mink lung cells. The values represent fold induction as determined by comparing with the basal activity of each reporter. Transactivation of (CAGA)9-MLP-Luc by BMP stimulation is too low to see (see the values of the fold induction). (C) Transactivation of 12xGCCG-Lux was tested in C3H10T1/2 (left panel) and ATDC5 (right panel) cells. The values represent fold induction as determined by comparing with the basal activity of the reporter.

