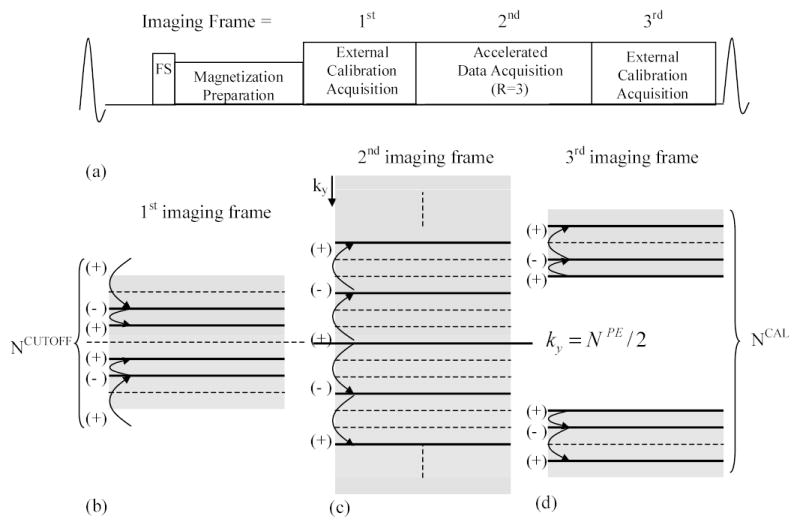
Figure 1.

A schematic of extended data acquisition over three imaging frames (a) with view ordering (b–d) (solid: measured line, dot: missing line, FS: frequency selective fat saturation pulse, ky: PE index, NPE: total number of PE lines). (+) and (−) represent an alternating RF phase for the PE lines acquired in the neighborhood.
