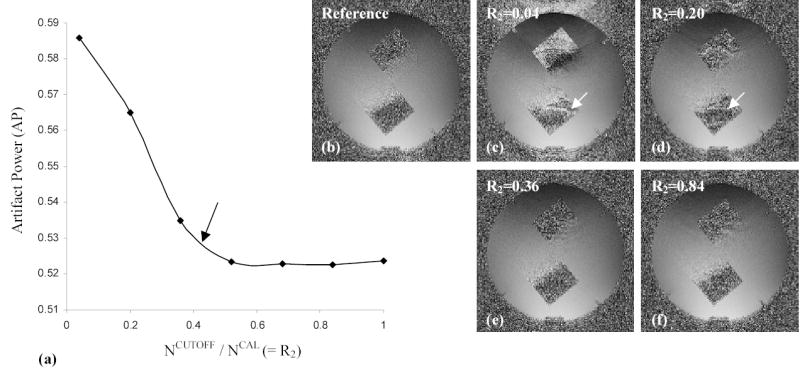
Figure 3.

Artifact power (AP) (a) and the corresponding coil sensitivity images (b–f) at different ratios of R2 (R1 = 0.4). Note that AP remains nearly the same at R2 > 0.4 and signal discontinuity related artifacts in the coil sensitivity map are suppressed as R2 is increased.
