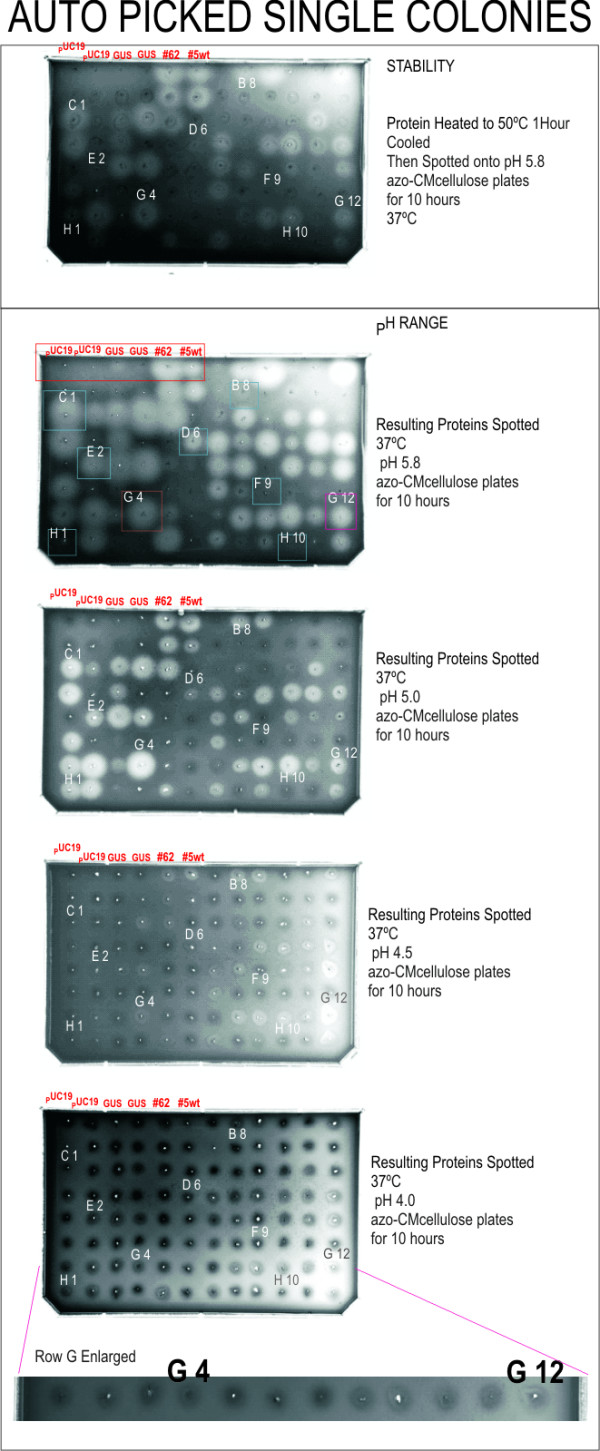
Figure 7.

Azo-CMC plate analysis of expressed protein from robotically picked individual colonies. Individual mutants are identified by row (letter) and column (number) on the plate and method of picking (AP – automated picking). Controls are found in the first six locations in the top two rows. Boxed mutants were selected for Western blot analysis (Figure 8) based on activity at low pH and after heating. Colors and letter/number identifiers correspond to those in Figure 8. Row G is enlarged in the inset at bottom to better visualize cleared zones.
