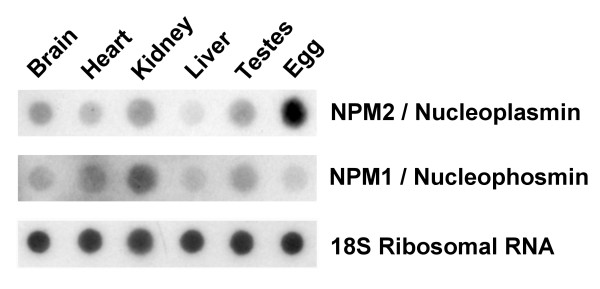
Figure 7.

Northern dot blot hybridizations comparing Npm2 and Npm1 mRNA levels in different R. catesbeiana tissues. In the top two rows 7.5 μg of total RNA was loaded per well and the blot was probed with P32 labeled X. laevis Npm1 or R. catesbeiana Npm2 cDNA amplified from PCR. In the bottom row 1.5 μg of total RNA was loaded per well and the blot was probed with a P32 labeled 18S ribosome cDNA probe which was used as a loading control.
