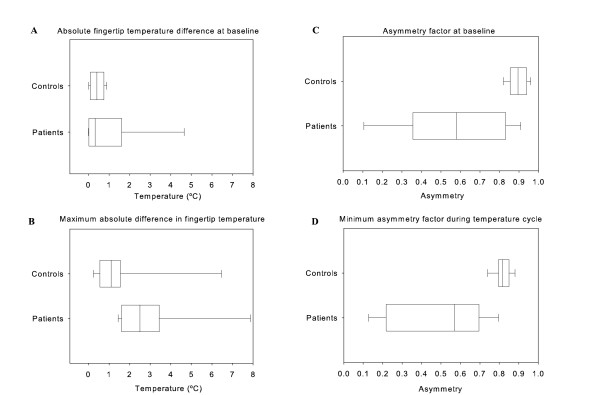
Figure 2.
Differences between controls and patients at baseline and during the temperature cycle. A, the absolute average temperature difference between fingertips at baseline. B, the maximum absolute average temperature difference between fingertips during the cycle. C, the asymmetry factor at baseline. D, the minimum asymmetry factor during the temperature cycle.

