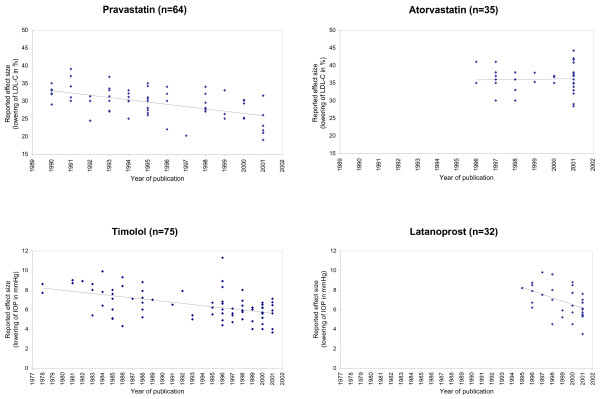
Figure 2.
Regression analysis of the relation between year of publication and reported effectiveness of Pravastatin (y = 90.818 – 0.643x; P < 0.0001), Atorvastatin (y = 29.900 + 0.062x; P = 0.8618, not significant), Timolol (y = 16.983 – 0.113x; P < 0.0001), and Latanoprost (y = 42.069 – 0.356x; P = 0.0074). Abbreviations: IOP, intraocular pressure; LDL-C, low-density lipoprotein cholesterol; x, reported effectiveness (for Timolol and Latanoprost change of IOP measured in mmHg, for Pravastatin and Atorvastatin change of LDL-C measured in %); y, year of publication minus 1900.

