
Figure 1.
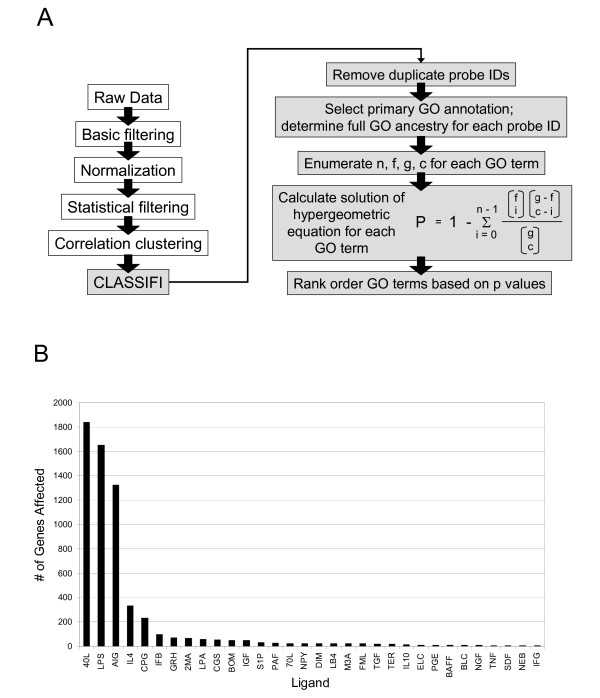
Experimental methodology and analysis of microarray data. (A) Schematic of steps performed during microarray data processing. Gray boxes indicate steps performed as part of the CLASSIFI component of the analysis. See text for details. (B) The number of genes whose expression was significantly changed at the 4 hr timepoint as determined by SAM is shown for each of 32 ligands. Abbreviations and descriptions for each ligand can be found at [22]. 40L = CD40L (anti-CD40), LPS = Lipopolysaccharide, and AIG = anti-IgM.