
Figure 4.
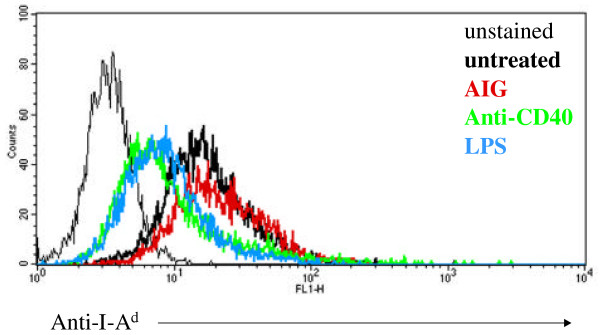
Class II MHC expression in AIG, anti-CD40, and LPS stimulated WEHI-231. Flow cytometric analysis of Class II I-Ad expression in WEHI-231 in response to overnight stimulation with AIG (red), anti-CD40 (green), and LPS (blue) or media alone (thick black line). Thin black line represents the unstained control.