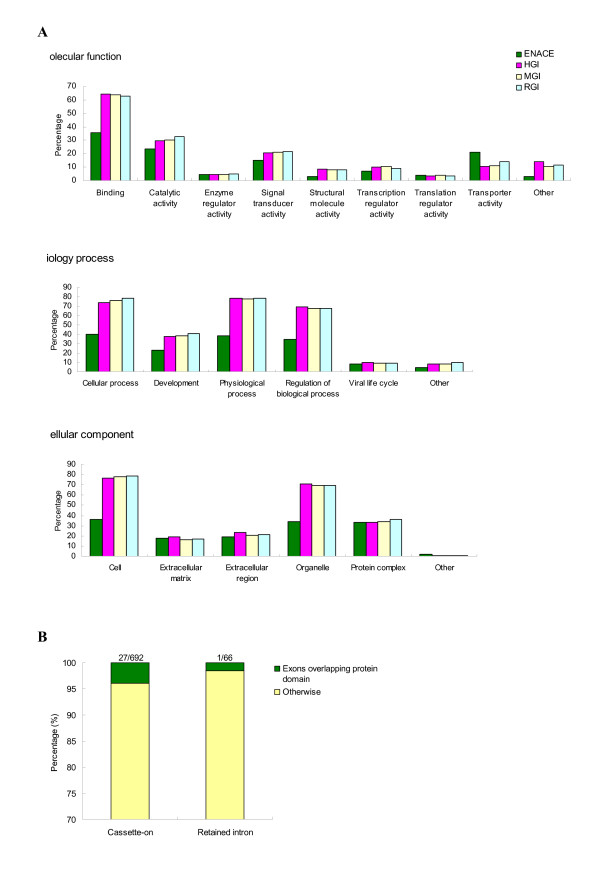
Figure 3.

Functional analyses of protein-coding ENACE exons. (A) Distribution of ENACE exons and ESTs of Human Gene Index (HGI), Mouse Gene Index (MGI) and Rat Gene Index (RGI) over gene ontology subcategories. (B) Proportions of ENACE exons that overlap protein domains.
