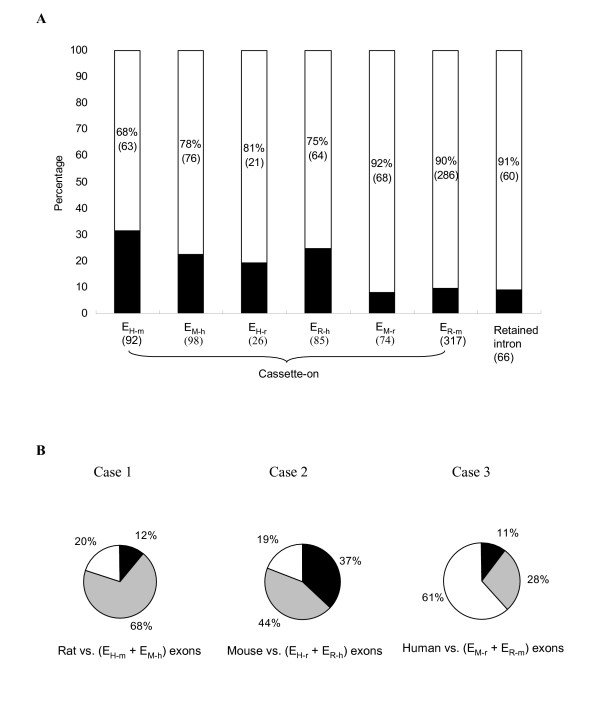
Figure 4.

Evolutionary analyses of protein-coding ENACE exons. (A) Proportions of ENACE exons that do not pass the KA/KS ratio test (white area) and those that do (black area). (B) Comparison of conservation of ENACE exons in the third species other than the target and source species. Case 1: conservation of EH-m and EM-h exons in rat; Case 2: conservation of EH-r and ER-hexons in mouse; Case 3: conservation of EM-r and ER-m exons in human. Black and grey color indicates proportion of ENACE exons conserved in the ESTs and in the genome (but not in the ESTs) of the third species, respectively. White color represents proportion of ENACE exons that are not conserved in the third species.
