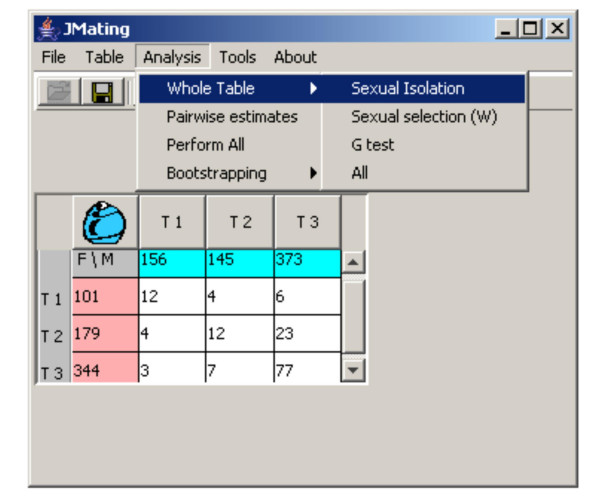
Figure 1.
Example 1 of multiple choice data obtained in a field study where the frequency of three morphs and their corresponding mating pairs were recorded [12]. Coloured marginal cells represent the frequency of the three mating types (T1, T2 and T3) in males (blue) or females (pink) sampled. The numbers within the cells in the table represent the observed mating pairs for each particular combination of mating types and sexes.

