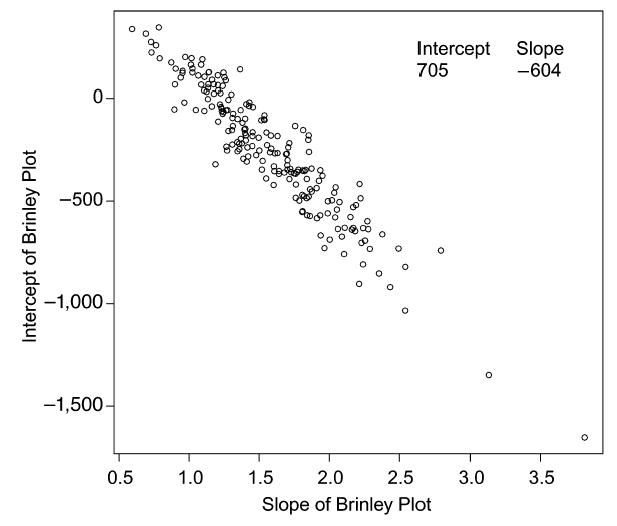
Figure 1.

A plot of intercept and slopes from Brinley functions when there is random variation across 200 simulated experiments in the overall means and SDs across conditions. For each simulated experiment, for older subjects, a mean RT was selected from a normal distribution with mean 700 msec and SD 70 msec, and an SD was selected from a normal distribution with mean 150 msec and SD 30 msec. For young subjects, a mean RT was selected from a normal distribution with mean 600 msec and SD 50 msec, and an SD was selected from a normal distribution with mean 100 msec and SD 20 msec. The Brinley slope and intercept were calculated for each of the 200 simulated experiments, and these provide the basis of the plot.
