
Figure 3.
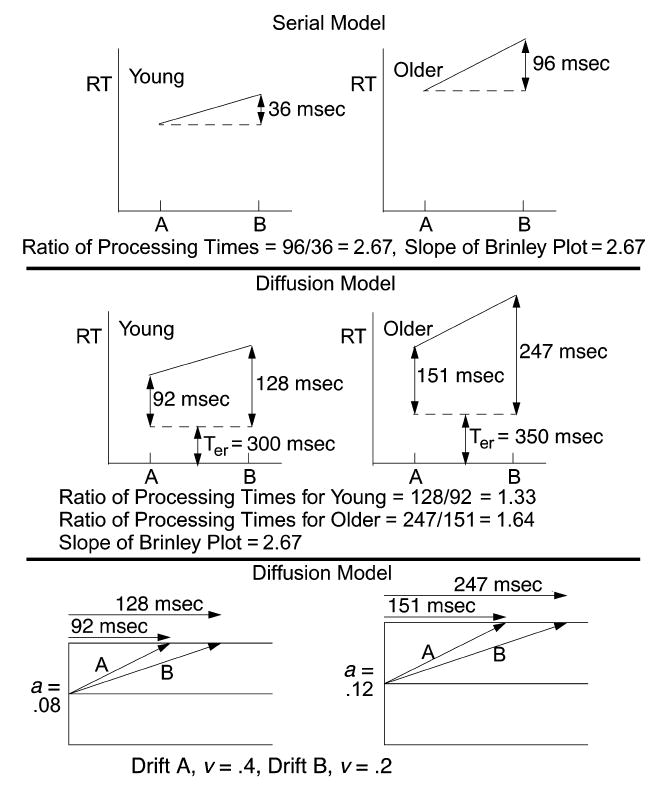
An illustration of predictions from a serial processing model and a diffusion model applied to mean RT. The RT values are derived from a diffusion model with parameters: Condition A, a = 0.08, Ter = 0.3, η = 0.08, Sz = 0.02 drift rates 0.2 and 0.4, and St = 0.1; and Condition B, a = 0.12, Ter = 0.35, η = 0.08, Sz = 0.02, drift rates 0.2 and 0.4, and St = 0.1. a = boundary separation, Ter = nondecision component of RT, η = SD in drift across trials, Sz = range in starting point across trials, and St = and range in the distribution of Ter.