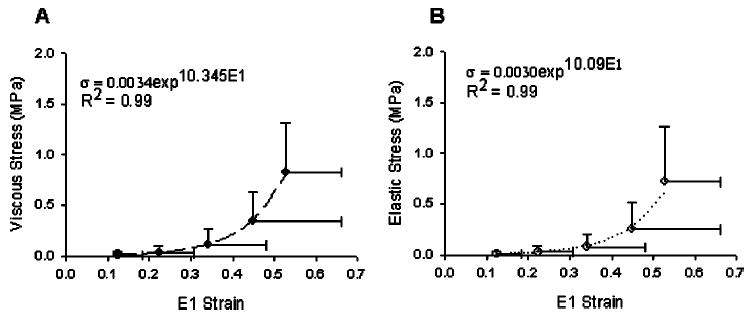
Fig. 4.

(A) Parallel to the primary axis of the collagen fibers, the mean viscous stress-strain relationship for all joint levels (L1–2 – L5-S1) was exponential in form (regression line shown). The viscous stress was computed as the peak load value that occurred during a ramp-hold trial to a specified uniaxial strain. The peak load always occurred at the end of the ramp up. (B) Parallel to the primary axis of the collagen fibers, the mean elastic stress-strain relationship for all joint levels (L1–2 – L5-S1) was exponential in form (regression line shown). The elastic stress was computed from the average load during the last 5 s of a 300 s hold at incremental ramp strains. Error bars are standard deviations.
