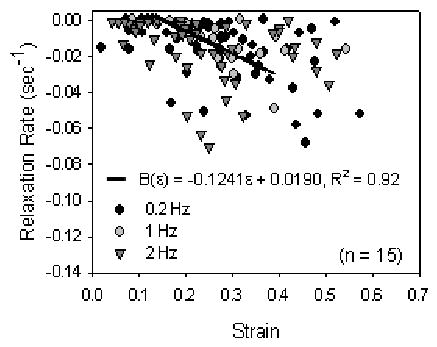
Fig. 9.

The load relaxation rate parallel to the collagen fibers was dependent upon strain magnitude during dynamic loading trials, but was independent of cyclic frequency (p <0.001 and p =0.744, respectively, two-factor ANOVA with Tukey). The relaxation rate was determined from the load and time values at each peak of twenty cycles, normalized to the maximum load (which was always during the first cycle), then finding the slope of the log (load)-log (time) plot. The relaxation rate significantly increased with increasing strain magnitude 10% vs 30%–50%: p <0.001; 20% vs 40%–50%: p <0.001; 30% vs 50%: p =0.001; 30% vs 40%: p =0.001). Data for all frequencies were combined and a strain-dependent relaxation function was defined for mean rate-strain data with coefficients: B ( ε) = − 0.1249 ε + 0.0190, R 2 =0.92.
