
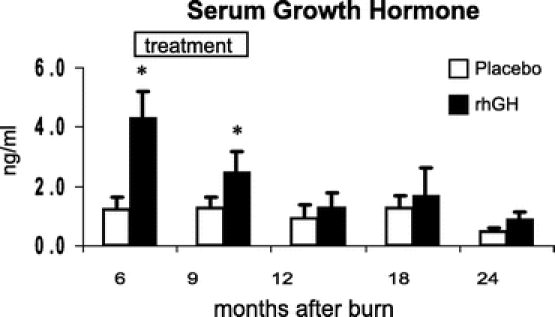
FIGURE 6. Serum concentrations of human growth hormone with time after burn. Values are mean ± SEM. *Significant difference between rhGH and placebo (P < 0.05).
Official websites use .gov
A
.gov website belongs to an official
government organization in the United States.
Secure .gov websites use HTTPS
A lock (
) or https:// means you've safely
connected to the .gov website. Share sensitive
information only on official, secure websites.
FIGURE 6. Serum concentrations of human growth hormone with time after burn. Values are mean ± SEM. *Significant difference between rhGH and placebo (P < 0.05).