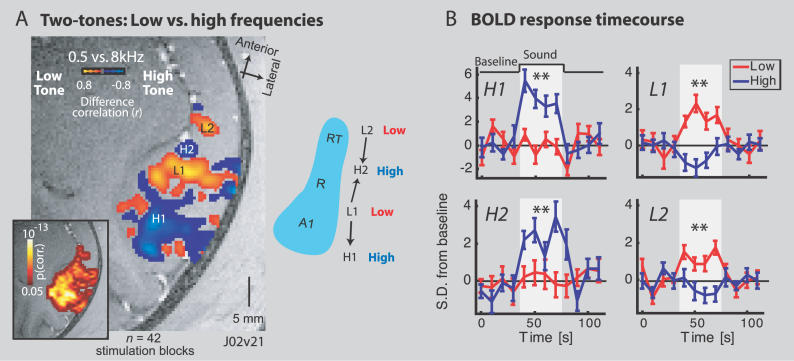
Figure 3. Two Tones Reveal Multiple Frequency Selective Regions over the Auditory Core.
(A) An experiment with alternating blocks of 0.5 kHz (Low) and 8 kHz (High) frequency tones. First, significantly active voxels to these sounds are identified (see inset). Within this region, individual voxels' frequency selectivity is determined by the difference in the signal correlation to the Low (red to yellow) vs. High (blue to cyan) tones. The results are thresholded to not display weakly frequency selective voxels. Four frequency selective regions are observed: (H1) labels a posterior high-frequency selective region, (L1) a more anterior low-frequency region that could be shared by the anterior portion of A1 and the posterior of R (see schematic of the auditory core to right), (H2) an anterior high-frequency selective region, shared by R and RT, and (L2) the most anterior low-frequency selective region observed, belonging to field RT (also see Figure 2D).
(B) Timecourse of the BOLD response illustrating that clusters of voxels underneath the labels in (A) showed greater activation to the high frequency tone at H1 and H2 but greater activation to the low frequency tone at L1 and L2 (see ** during sound stimulation periods; t-tests, all p < 0.002). Error-bars signify standard error of the mean across stimulation block repeats.

