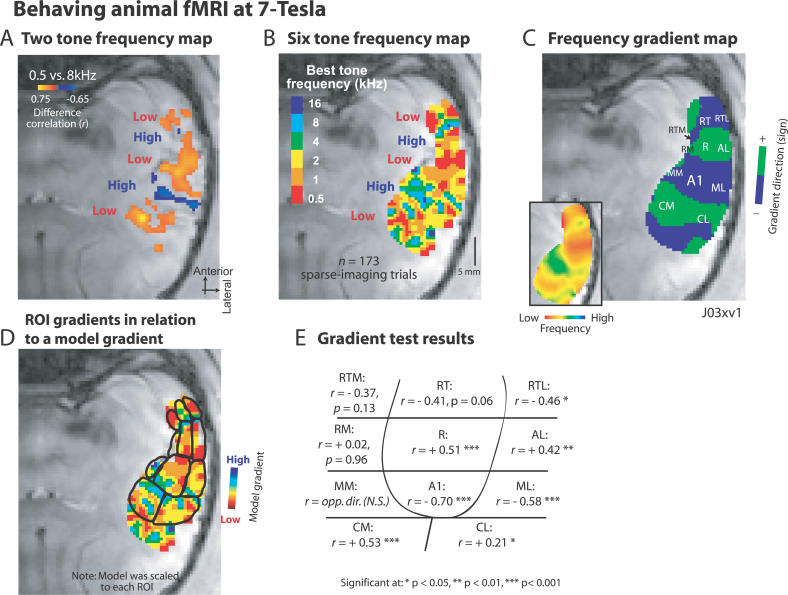
Figure 6. Functional Tessellation of the Behaving Animal's Auditory Cortex.
(A) Contrasting responses to two tones reveals an extended alternating pattern of (Low, High, Low, High, Low) frequency selectivity. (B) Multi-tone frequency map. (C) Gradient analysis. (D) Delineated auditory cortex ROIs. (E) Statistical results of the ROI gradient tests; format as for Figure 5 (A), (C–E). Note that the (n) for these data reflect the number of correctly completed trials, whereas for the anesthetized animal imaging one stimulation block contains four sparse-imaging sequences, or such “trials.”

