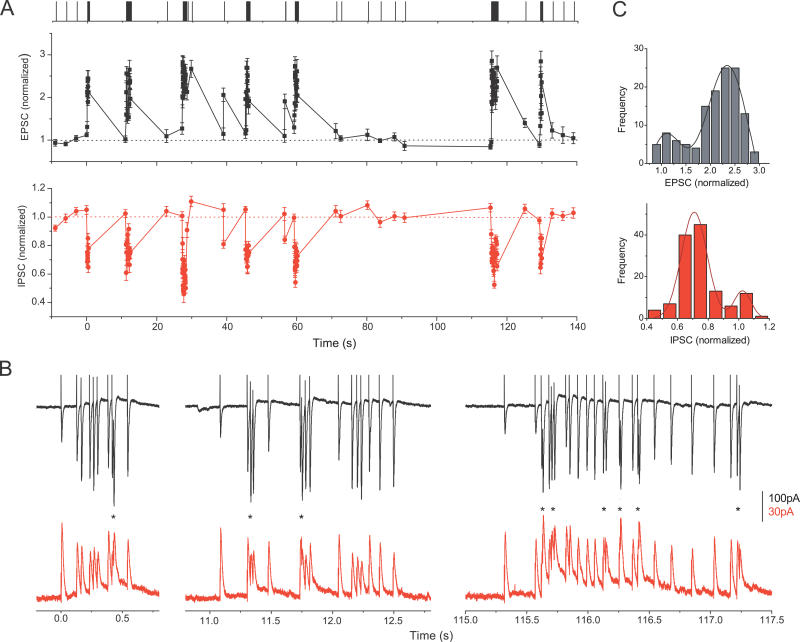
Figure 1. Excitatory and Inhibitory Synapses Act as Adaptive Filters during Natural Spike Trains.
(A) The top trace illustrates a natural spike train, with each vertical line indicating an action potential in the presynaptic neuron. Relative changes in whole-cell EPSCs (middle trace; black) and IPSCs (lower trace; red) recorded from two different cells during the natural stimulation pattern shown on the top. Each point is an average of four (EPSCs) or seven (IPSCs) recordings from the same cell. Current peak values are normalized to average control values recorded at 0.1 Hz before each stimulation epoch. Four controls before and three after the train are shown, but they are plotted on a shorter timescale for clarity.
(B) Three representative raw EPSC (top, black) and IPSC (bottom, red) responses (synaptic current as a function of time) to high-frequency epochs, recorded from the same cells as in (A). Responses to the first, second and sixth epochs are shown. An asterisk (*) denotes frequent cases of summation of closely spaced responses, that, in the case of IPSCs, may occasionally reach levels larger than control (see text for details).
(C) Distributions of amplitude changes for data in (A). The amplitude distributions were approximated with two overlapping Gaussians centered at the peaks. Top panel (black) for EPSCs and bottom panel (red) for IPSCs.

