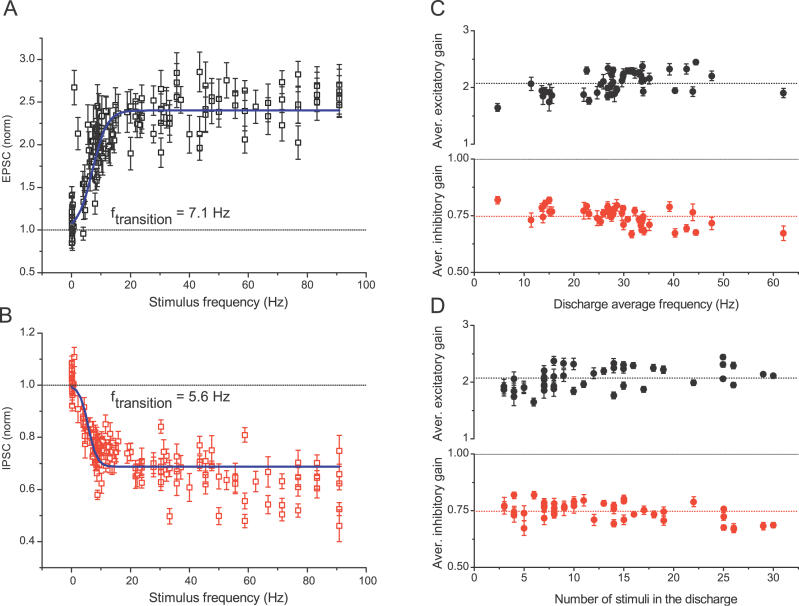
Figure 2. Changes in Excitatory and Inhibitory Synaptic Strength Occur between Two Near-Constant Levels and Are Largely Independent of the Discharge Temporal Pattern.
(A and B) Excitatory (A) and inhibitory (B) gain values (from Figure 1A) are plotted as a function of the stimulus frequency in the train (1/ISI) and show a rapid transition from one gain level to another. The solid lines represent sigmoidal Boltzmann equation fits with A1 set to 1 and give the transition frequency of 7.1 and 5.6 Hz for excitatory and inhibitory gain changes, respectively. Note that as long as the stimulus is within the discharge, it is likely to result in an elevated gain level, even though its frequency might be below the gain transition range. Two such responses at approximately 1 and 2.5 Hz can be seen in (A), but are infrequent.
(C and D) Average changes in excitatory (top) and inhibitory (bottom) synaptic gain during each high-frequency epoch (see Materials and Methods for definition) are plotted as a function of the average stimulus frequency within the epoch (C) and the number of stimuli in the epoch (D) for 44 epochs from five different patterns ( n = 36, 14 cells). Note that the plots for excitatory and inhibitory gain changes are shown on different scales.

