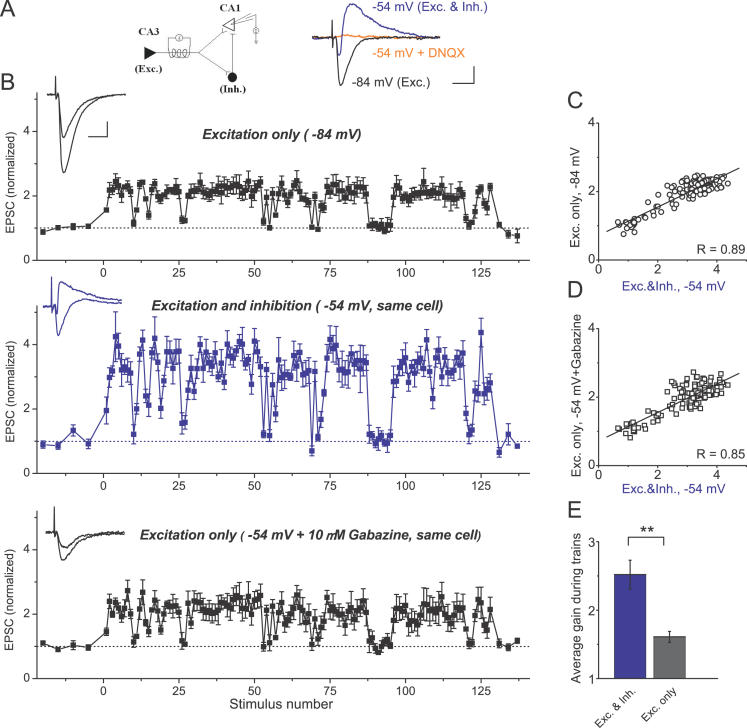
Figure 6. Feed-Forward Inhibition Provides Additional Gain for Excitatory Transmission Selectively during High-Frequency Epochs.
(A) A schematic of a basic disynaptic feed-forward circuit unit in the hippocampal CA3-CA1 areas (left panel). Pure excitatory responses (Exc.) were isolated by holding the cell membrane near the Cl − reversal potential (−84 mV) in the absence of AMPA/GABA A receptor antagonists (black sample whole-cell recording trace in the right panel). EPSC/IPSC sequence (Exc. & Inh.) was recorded in the same cell by changing the holding potential to −54 mV (blue sample trace in the right panel). EPSC/IPSC sequence was completely blocked by the AMPA receptor antagonist DNQX (orange sample trace in the right panel), demonstrating the absence of direct stimulation of local inhibitory fibers. Scale bars indicate 10 ms and 100 pA.
(B) Top panel: pure excitatory responses to natural stimulus train (same train as in Figure 1) recorded at −84 mV from a different cell than that in (A). The average gain during the train was 1.61 ± 0.08, n = 9. The average gain during natural stimulation was significantly larger at −54 mV (middle panel), where excitation and inhibition were present together ( p < 0.005, n = 9). This additional gain increase was completely blocked at −54 mV by GABA A receptor antagonist gabazine ( p > 0.9, bottom panel). Note that in none of these recordings did we subtract contributions from the preceding currents. All recordings shown were from the same cell, and each point was an average of four responses. Each dataset was normalized to its own control. Voltage measurements were a posteriori corrected for the liquid junction potential (see Materials and Methods). Insets: Representative single traces of control current and current with increased gain during one of the discharges are shown for each panel. Scale bars indicate 10 ms and 100 pA.
(C) Correlation of response amplitudes from (B) recorded at −84 mV (Excitation only) and at −54 mV (Excitation + Inhibition).
(D) Correlation of response amplitudes from (B) recorded at −54 mV after gabazine application (Excitation only) and before gabazine application (Excitation + Inhibition).
(E) Average gain during natural spike trains (all points included) for excitation alone (Exc. only) or in the presence of inhibition (Exc. & Inh.); n = 9 cells, two different patterns.
** indicates p < 0.005.

