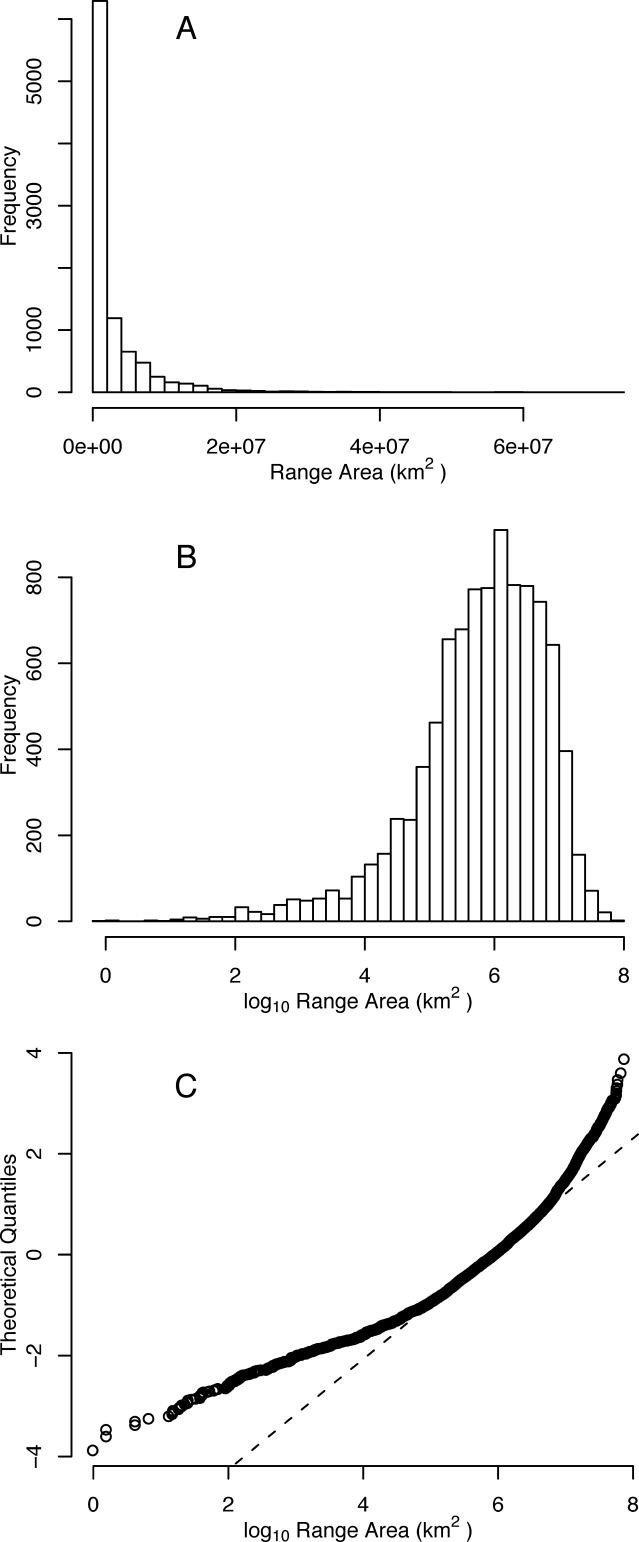
Figure 1. Species-Range Area Distribution for the Global Avifauna.
(A) Untransformed range areas. (B) Log 10-transformed range areas. (C) Normal probability plot for log 10-transformed range areas, showing the expectation under a normal distribution (dashed line) and the observed distribution (open circles).

