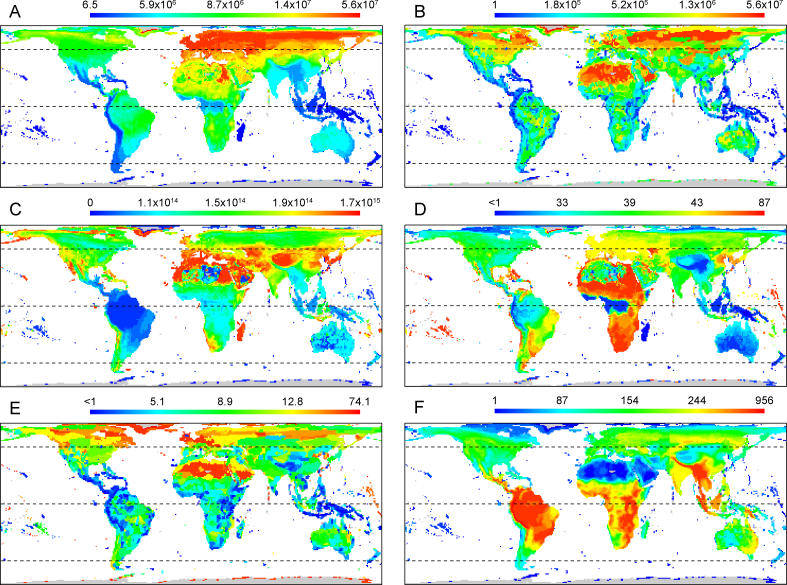
Figure 2. Geographic Distribution of Geographic Range Areas, Latitudinal Range Extent, and Species Richness for the Global Avifauna.
(A) Median geographic range area (km 2). (B) Minimum geographic range area (km 2). (C) Variance in geographic range area (km 2). (D) Median latitudinal range extent (degrees). (E) Minimum latitudinal range extent (degrees). (F) Total species richness. The map scales are based on quartiles of the underlying distributions; the scale bars show the quartile values for each map. Parallels are shown at 45° S, the Equator, and 45° N.

