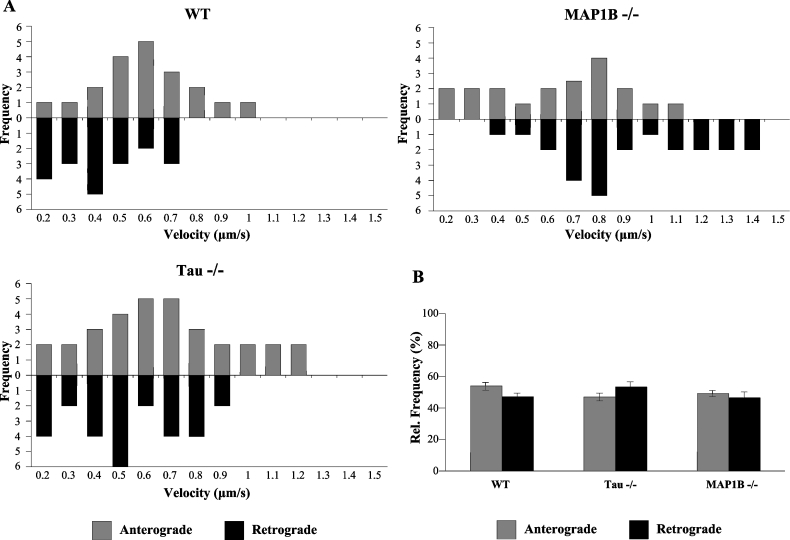
Figure 4. Anterograde and retrograde mitochondrial movements in neurons from wild-type, tau−/− and MAP1B−/− mice.
(A) Anterograde and retrograde velocity distribution of mitochondrial movement in neurons from wild-type (WT), tau−/− and MAP1B−/− mice. (B) Relative (Rel.) frequency of anterograde and retrograde mitochondrial movements in neurons from wild-type (WT), tau−/− and MAP1B−/− mice. Different numbers of mitochondria (40 mitochondria for wild-type, 60 for tau−/− and 44 for MAP1B−/− mice) were analysed. Data are summarized in Table 1.

