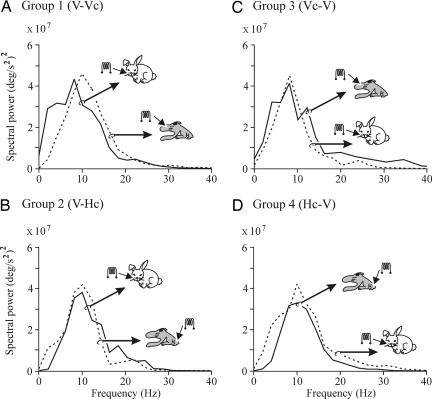
Fig. 5.
Frequency domain analyses of eyelid CRs evoked by peripheral and central stimuli used as CS. Histograms showing the mean power spectra of acceleration profiles computed from CRs evoked by CS-alone presentations. Each power spectrum was averaged from ≥12 records. Records were collected from the 6th (continuous lines) or 11th (dotted lines) conditioning sessions for the indicated experimental groups. The CS evoking each record is also indicated. No significant differences were detected between each pair of power spectra (P ≥ 0.1, χ2-distributed test; correlation coefficient ≥0.996, P ≤ 0.005, Pearson test). V, vibrissae; Hc and Vc, hind-limb and vibrissa S1 cortices.

