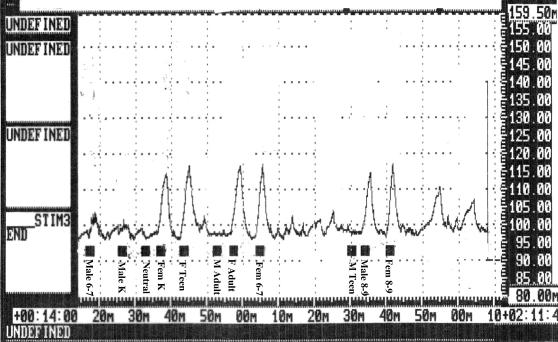
Figure 1. Printout showing the results of an arousal assessment.
The data path represents real-time changes in penile circumference in response to the presentation of the stimuli. The stimulus presentations are indicated by the solid bars underneath the data path. The numbers on the right side of the figure represent millimeter change in penile circumference.

