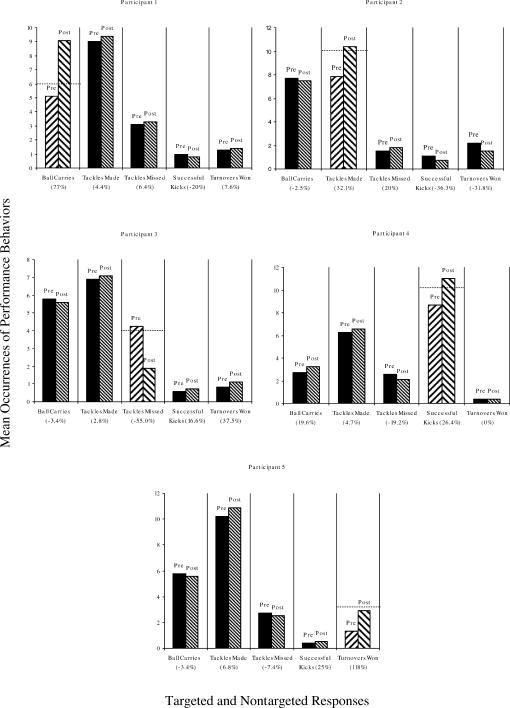
Figure 1. Mean occurrences of performance behaviors on targeted and nontargeted components pre- and postintervention for Participants 1 through 5.
 and
and  bars represent targeted components pre- and postintervention, respectively.
  and
and  bars represent nontargeted components pre- and postintervention, respectively. Dashed horizontal lines represent the expected level of treatment success. Figures in brackets represent the relative percentage changes in performance behaviors pre- and postintervention. For the performance behavior of tackles missed, lower numbers indicate better performance.

