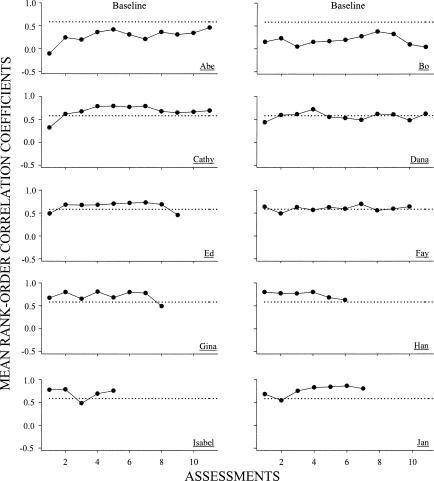
Figure 2. A description of preference stability for each participant is shown in each of the 10 panels.
Mean rank order correlation coefficients were derived by comparing ranks from each preference assessment with ranks from every other preference assessment. Points above the dotted lines indicate strong positive correlations, exceeding a critical r value.

