Figure 3.

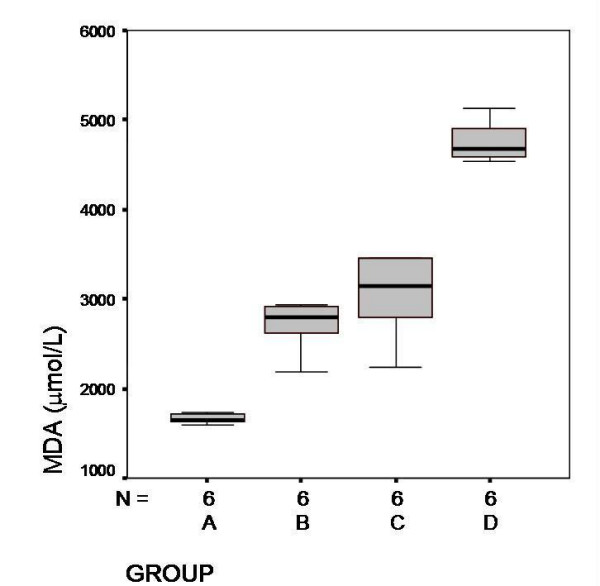
Serum MDA levels and mean values in each groups (μmol/L). Group D, significantly higher than the other groups (P < 0,001)

Serum MDA levels and mean values in each groups (μmol/L). Group D, significantly higher than the other groups (P < 0,001)