
Figure 2.
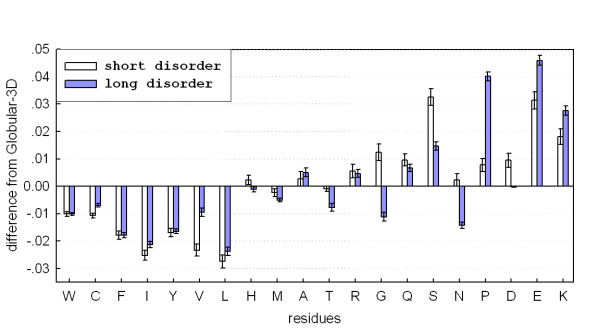
Comparison of amino acid compositions between short and long disordered regions. The y-axis represents the difference in amino acid compositions (fractions) from a reference dataset of ordered proteins, Globular-3D. The error bars correspond to one standard deviation estimated using 5,000 bootstrap samples. His-tags and initial methionines were not counted.