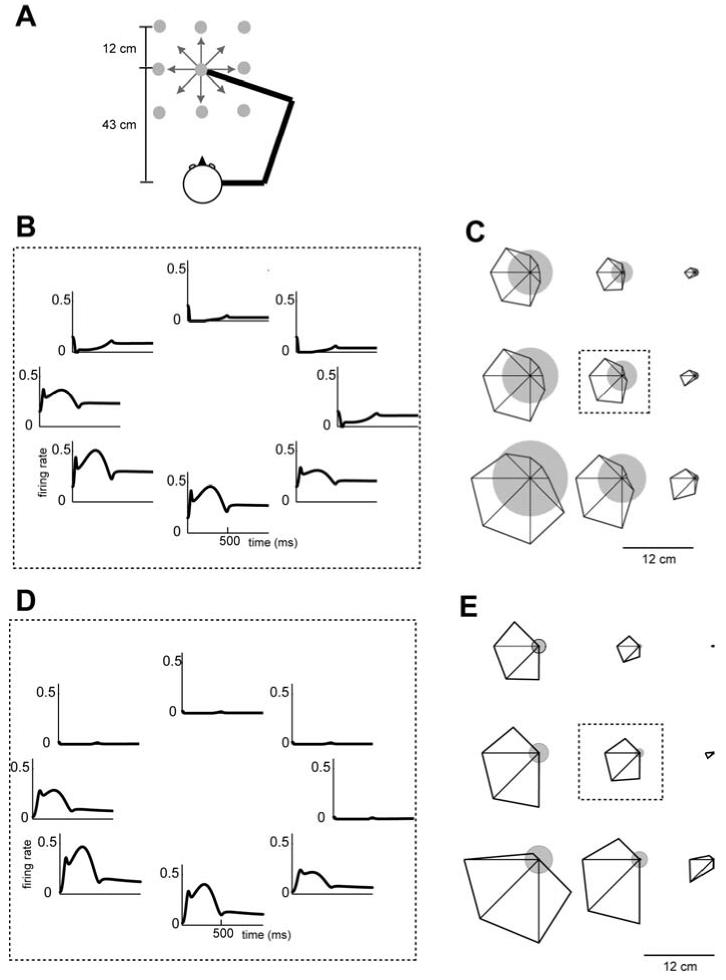
Figure 2.
A tuning curve of example muscle spindle-like basis elements in a center-out reaching task. (A) Spatial configuration of movements used in tuning curve calculation. Eight directional center-out reaching on a horizontal plane at the shoulder level were simulated in nine different center locations (grey dots). (B) Firing rate of a basis element (a=100, b=100, c=−25, λ =80, θpref = [cos(π / 8) sin(π / 8)]T ) as a function of time when the center position was the middle point in 3×3 grid. (c) Tuning curves at nine different center locations. Size of the circle at each location represents the mean firing rate during the center-hold period (500 ms). Distance from center of circle to vertex of polygon represents the firing rate for reaching in that direction. The direction with the largest distance from the center is the preferred direction of this cell. The plot in the center bounded by a dashed rectangle uses the same data in (a). (D)-(E) The same format as in (B)-(C) for another basis element (a=0.1, b=250, c=−15, λ =80, θpref = [cos(π / 8) sin(π / 8)]T ).

