Figure 5.
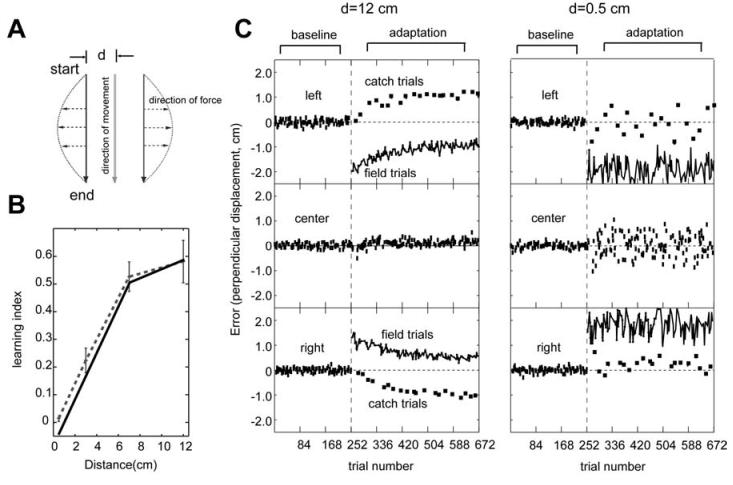
Simulation of adaptation to a position and velocity dependent force field. (A) The position-velocity dependent force field. (B) The learning performance in the force field described in (a) increases as a function of separation distance. The dotted line is the experimental data excerpted from Hwang et al. (2003) and solid line is the simulation data. (C) Reach errors as a function of trial number in distances of d=12cm and d=0.5cm, respectively (d refers to distance between movements in (a)). Errors for the left, center and right reach trials are plotted in the top, middle and bottom panels, respectively. In the adaptation sets, the squares represent catch trials and the connected lines represent field trials.

