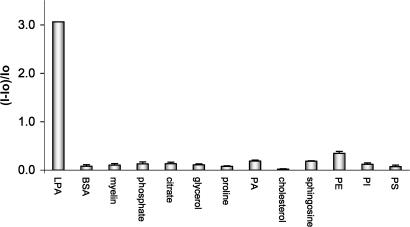
Fig. 14.
Relative fluorescence intensity changes of solutions of 2 in MeOH (5.53 × 10⁻⁶ M) in the presence of various phospholipids (LPA and PA; 1.1 × 10⁻⁴ M) and other charged and neutral analytes. Concentration of other analytes was 1.1 × 10⁻³ M. The standard deviation (n = 3) of the relative fluorescence intensity for each analyte ranges from 0.01 to 0.11.

