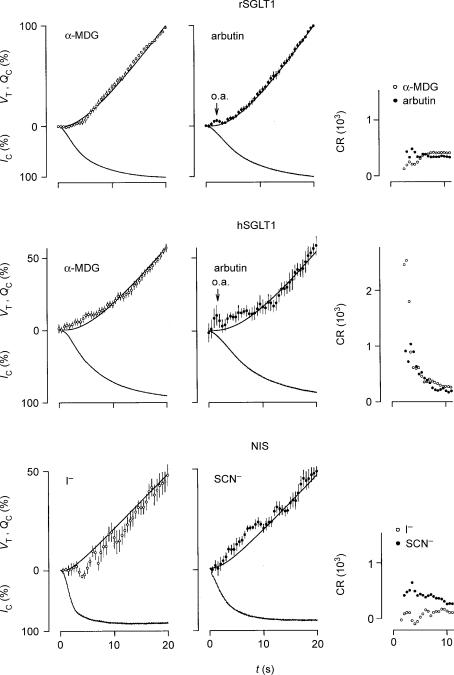
Figure 5. Initial changes in oocyte volume (VT), clamp current (IC), charge accumulation (Qc), and coupling ratio (CR) induced by isosmotic application of substrate at t=0.
The average VT values (open or filled circles) were calculated every 0.5 s and given with vertical s.e.m. bars. The values are compared with the accumulation of charge (QC, upper smooth line), which equal the integrated IC (lower trace). The values for rSGLT1 were normalized relative to the values obtained after 20 s where IC had reached more than 95% saturation. We employed clamp voltages of −50 mV and 2–5 mm of α-MDG (n= 13) or arbutin (n= 7); the s.e.m.s of the currents (not shown) were less than 1% in case of both α-MDG and arbutin. The values for hSGLT1 were normalized relative to the values obtained after 30 s where IC had reached more than 95% saturation. We used 5 mm of α-MDG and clamp voltages of −50 and −90 mV (n= 18); the s.e.m.s of the currents (not shown) were less than 1%. Arbutin was tested at 5 mm and clamp potentials of −50 mV (n= 6); the s.e.m.s of the currents (not shown) were less than 3%. The application of arbutin induced an optical artefact seen as an apparent transient swelling (o.a.); this artefact was also present when wild type oocytes were tested and it was proportional to the concentration of arbutin. The values for the NIS were normalized relative to the values obtained after 40 s. Substrate concentrations were between 0.2 and 1 mm and the clamp potential was −70 mV. The s.e.m.s of the currents (not shown) were less than 4% for both I− (n= 9) and SCN− (n= 8). Running estimates of CR (proportional to VT/QC, see text) are given in the right-hand panels. For rSGLT1, the CRs were relatively constant during the first 10 s; only at around t= 5 s was there a small reduction in CR in the case of α-MDG. After about 5 s the CRs were close to their steady-state values. For hSGLT1, however, with both α-MDG and arbutin, the CRs were initially up to 10 times higher than the CRs obtained when IC saturated, which were 234 and 201, respectively. For NIS, the CR for I− was lower, and that for SCN− higher during the initial 10 s compared with the CRs obtained as IC saturated, which were 162 and 257, respectively. Please note that it was not possible to evaluate CR during the initial 2 s where the signal-to-noise ratio for QC is small; nor was it possible when arbutin induced the optical artefact (o.a.).

