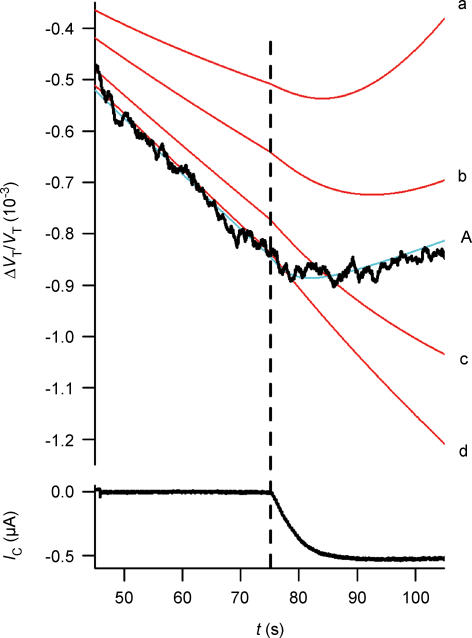
Figure 10. Uphill transport of water.
An rSGLT1-expressing oocyte was exposed at time zero to an osmotic gradient of 5 mosmol obtained by adding mannitol to the bathing solution. This induced a constant rate of osmotic shrinkage as given by the relative volume changes, ΔVT/VT, jagged line. At t= 75 s the 5 mm mannitol was replaced by 5 mmα-MDG. This gave rise to an increase in IC and oocyte swelling despite the adverse osmotic gradient. The change in oocyte volume could be simulated using the measured value for CR of 288 and an Lp of 0.5 before sugar application and 0.67 after sugar application, in units of cm s−1 (osmol l−1)−1 (blue line, A). VF/VT was taken as 0.4 and Di as 0.5 × 10⁻⁵ cm2 s−1. The volume changes were also simulated assuming only osmotic transport of water (red curves), Di values of 0.5 × 10⁻⁵ (curve d), 0.5 × 10⁻⁶ (curve c), 0.5 × 10⁻⁷ (curve b), and 0.5 × 10⁻⁸ (curve a) were tested (units, cm2 s−1).

