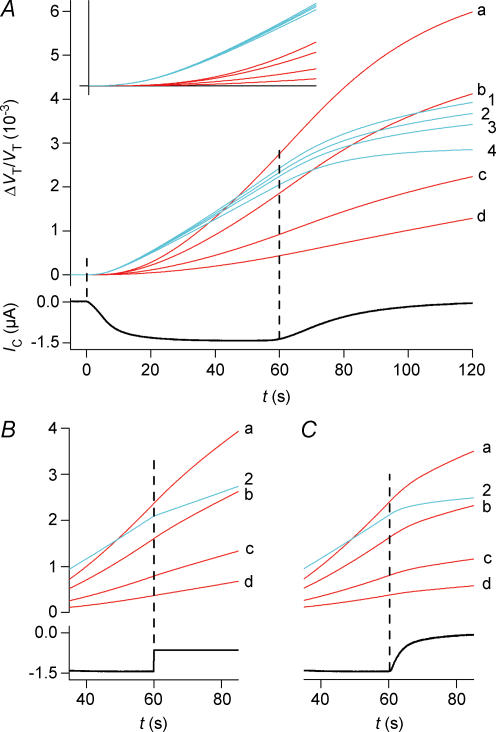
Figure 11. Simulation of volume changes.
Blue curves are simulations that involve cotransport of water; red curves involve only osmosis and unstirred layer effects. The simulations are based on the data from the hSGLT1-expressing oocyte shown in Fig. 2. A, isosmotic application of α-MDG. The activity of the cotransporter is given by IC. The blue curves (1–4) are simulations with a CR of 280 and an Lp of 0.7 × 10⁻⁵ cm s−1 osm l−1)−1. Three values of Di (cm2 s−1) were tested: curve 1, 0.33 × 10⁻⁵; curve 2, 0.5 × 10⁻⁵; curve 3, 0.75 × 10⁻⁵. The corresponding values of VF/VT were 0.3, 0.4 and 0.6. Curve 4 represents the contribution from the cotransport of water alone, which equals the integrated current. For the red curves, the influx of water takes place by osmosis only (CR = 0, Lp= 0.7 × 10⁻⁵ cm s−1 (osmol l−1)−1). Simulations with four values of Di are shown: curve a, 0.5 × 10⁻⁸; curve b, 0.5 × 10⁻⁷; curve c, 0.5 × 10⁻⁶; and curve d, 0.5 × 10⁻⁵ cm2 s−1; VF/VT was constant at 0.4. The inset shows the initial 20 s of volume changes; vertical bar 0.55 × 10⁻³. B, the experiments were terminated by an abrupt change in IC from 1400 nA to 650 nA elicited by a change in clamp voltage at 60 s (experiment as in Fig. 7). For the cotransport scenario only curve 2 is shown (blue). The red curves (a–d) have the same parameters as in A. C, the experiment was terminated by adding phlorizin at 60 s. This abolished the sugar-induced clamp current with a time constant of 5 s (see Fig. 9). Phlorizin was assumed to decrease the Lp from 0.71 to 0.42 × 10⁻⁵ cm s−1 (osmol l−1)−1. For the cotransport scenario only curve 2 is shown (blue). The red curves (a–d) have the same parameters as in A.

