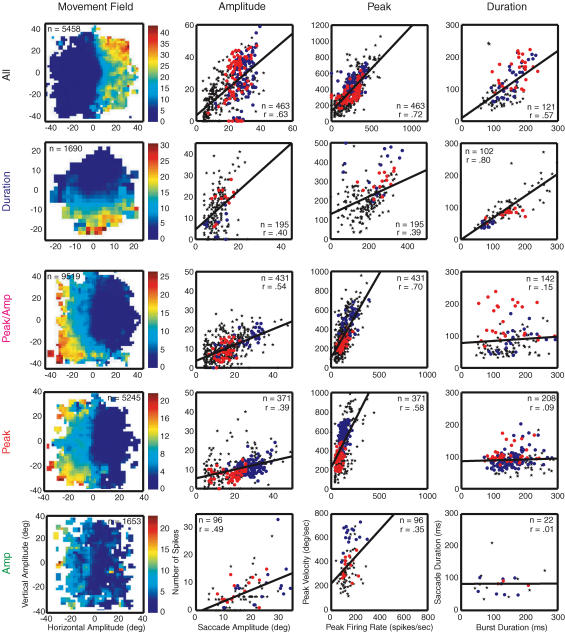
Figure 2. Representative movement fields & metrical relationships.
The movement fields and corresponding analysis of the three tested metrical relationships (amplitude, peak and duration) plotted for five representative cMRF neurones. Column 1: movement fields display spike number as a function of saccade direction and amplitude as if the eyes had started at primary position (i.e. in retinotopic coordinates) with warm colours (orange, red) indicating a higher average number of spikes than cool colours (blue, green). Areas in white were unsampled. Column 2: iso-direction plots along the optimal direction of each cell showing the ‘Amplitude’ relationship (number of spikes versus saccade amplitude) for VG (blue dots), MG (red dots), and all other saccades (black stars, including spontaneous saccades and saccades to the fixation light). Column 3: the ‘Peak’ relationship (peak velocity versus peak firing rate) and Column 4: ‘Duration’ relationship (saccade duration versus burst duration) for saccades along the optimal direction. Each example neurone appears to be better related to one or more saccade metrics (row label). Axis labels in the bottom row apply to the columns above.

