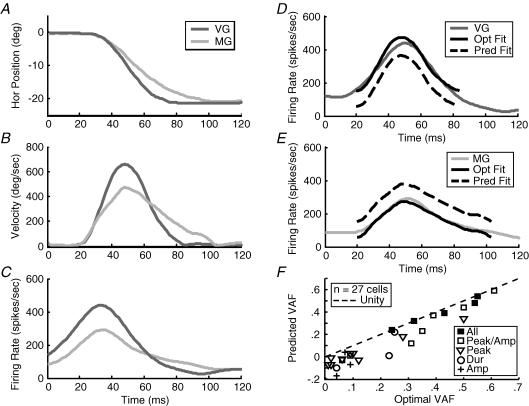
Figure 8. VG/MG comparisons.
A, single rightward VG and MG saccades of matching amplitude. B, the MG saccade has a lower peak velocity and longer duration than the VG saccade. C, the firing rate of the cell changed in conjunction with the instantaneous velocity of the two movements. Note the lower peak firing rate and prolonged discharge of the cell during the MG saccade. D, the firing rate during the VG saccade is shifted by the dynamic latency (td) of 17 ms and plotted with the mathematically optimal fit for the population of VG saccades (black line) and the predicted firing rate based on VG velocity and the a/b parameters from the MG model (dashed line). Model a parameters are different causing a displacement along the ordinate axis, but b parameters and VAF are the same between the optimal and predicted models. E, the firing rate of the cell during the MG movement overlaid with optimal and predicted fits. F, comparison of the VAFs from the optimal and predicted fits across our VG/MG comparisons population (27 cells). A prediction with a VAF as good as the optimal would fall on the line of unity (dashed line). For cells with reasonably high VAFs (> 0.2), we were able to accurately predict the firing rate during VG saccades based on the models created during MG saccades. This indicates that the difference in firing rate across the behaviours is due to the difference in dynamics between VG and MG saccades. Cells with multiple metrical relationships (‘All’, ‘Peak/Amp’) are more likely to be related to instantaneous velocity (fall farther right on the graph).

