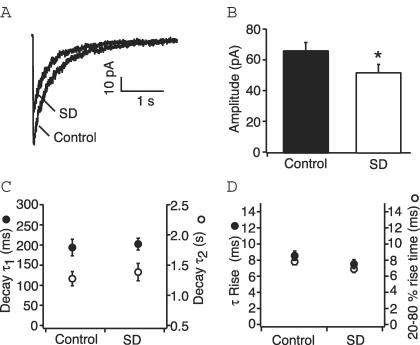
Figure 3. Properties of NMDA currents in patches from CA1 distal dendrites of control and sleep deprived rats.
A, representative NMDA currents from outside-out patches from control and sleep deprived rats in response to a 10 ms application of glutamate (250 μm). Traces are averages of 8–10 responses. B, bar graph plotting the mean amplitude for control and sleep deprived rats. Responses are significantly attenuated after sleep deprivation. *P < 0.05. C, mean values for the fast (left axis, •) and slow (right axis, ○) decay time constants of NMDA currents from control and sleep deprived rats show no significant difference. D, similarly sleep deprivation does not affect the rise time constant (left axis, •) or 20–80% rise time (right axis, ○) for the NMDA current.

