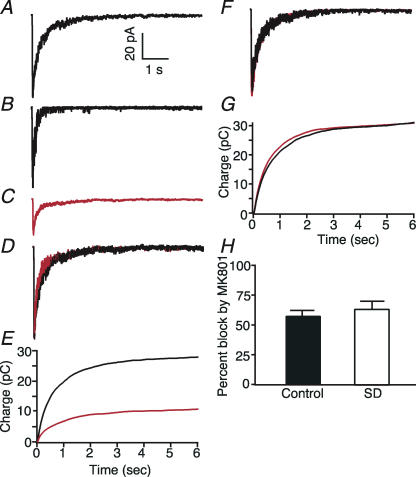
Figure 6. Glutamate activates NMDA receptors from control and sleep deprived rats with equal probability.
A, average NMDA response evoked by a 10 ms application of 1 mm glutamate to an outside out patch in the presence of 10 μm glycine and 5 μm NBQX. B, single response of the same patch as in A to a 10 ms exposure to 1 mm glutamate in the continuous presence of 20 μm MK-801. C, average response of the same patch to glutamate after washout of MK-801. D, superimposition of averaged currents recorded before (black) and after (red) the single exposure to glutamate in the presence of MK-801. The averaged current in C has been normalized to the peak amplitude of the response in A. E, currents in A (black) and C (red) have been integrated in time. F, superimposition of averaged responses of another patch to 1 mm glutamate (10 ms) before (black) and after (red) exposure to 20 μm MK-801 in the absence of glutamate. G, integration of currents in F in time. H, bar chart showing that the percentage block incurred by a 10 ms exposure to glutamate in the presence of MK-801 is similar for control and sleep deprived rats.

