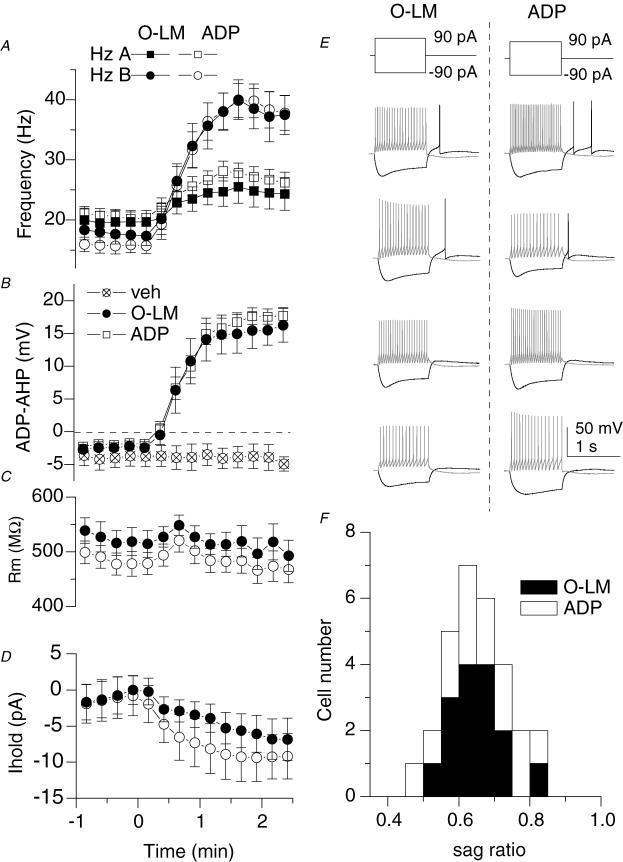
Figure 2. ADP-containing neurones and O-LM cells are highly overlapping cell populations.
A, plot of the AP frequency of the first 500 ms (Hz A; squares) versus the second 500 ms (Hz B; circles) during wash-in indicates a loss of accommodation. Open symbols represent ADP-containing cells (n= 31), a subset of which was anatomically identified as O-LM interneurones (n= 12; filled symbols). B, plot of the average membrane potential in a time window for the slow AHP (a 200–300 ms time window 100 ms after offset of current injection) during wash-in of muscarine. Crossed open symbols indicate the average of 3 cells in which no agonist (veh) was applied. C and D, plots of input resistance (C) and holding current (D) upon application of muscarine for 12 ADP-containing cells (○), including 8 O-LM cells (•). Input resistance was monitored by the peak deflection to 1 s, −20 pA current step occurring 10 s after each depolarizing current injection. Holding current was manually applied to maintain the voltage at −60 mV and monitored through a separate analog input channel. E, voltage responses to ± 90 pA, 1 s current injections from −60 mV for 4 O-LM cells and 4 ADP-containing unidentified cells. F, histograms of sag ratios for 29 ADP-containing cells (open bars), 15 of which were O-LM cells (filled bars). Sag ratio was calculated by the average voltage deflection in a 10 ms window at the end of a 1 s, −90 pA step divided by the peak voltage deflection during the current step.

