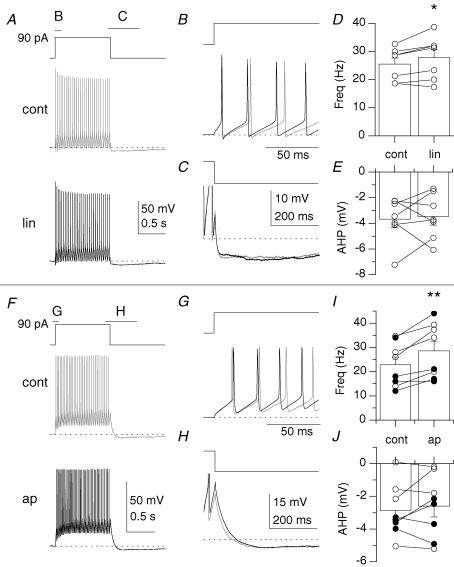
Figure 9. KCNQ- and SK2-mediated K+ channels do not control the emergence of the ADP.
A, voltage response to the introduction of a 90 pA current step from −60 mV in control (cont; grey) and in the presence of linopirdine (lin; black). B and C illustrate overlaid regions in A at expanded time scales. D and E, plots of action potential frequency in the first 500 ms (D) or average membrane potential in a 200–300 ms time window 100 ms after offset of current injection (E) for 7 stratum oriens interneurones. F, voltage response to the introduction of a 90 pA current step from −60 mV in control (cont) and in the presence of apamin (ap). G and H illustrate regions in F at expanded time scales. I and J, plots of action potential frequency in the first 500 ms (I) or average membrane potential in a 200–300 ms time window 100 ms after offset of current injection (J) for 8 stratum oriens interneurones. Filled circles indicate anatomically identified O-LM cells.

