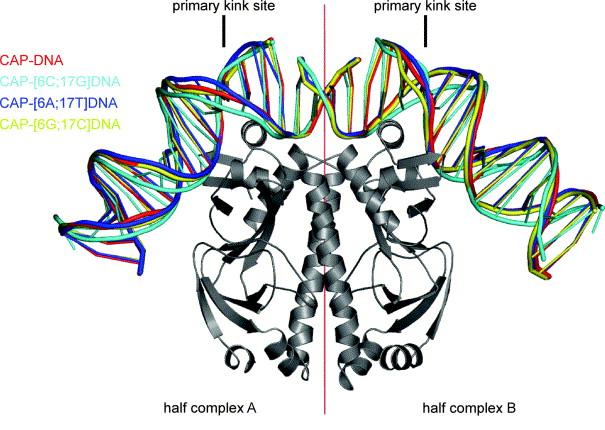
Figure 2.

Superimposed structures of complexes of CAP with DNA sites containing all possible base pairs at position 6 of the primary-kink site obtained in this study. CAP is presented in a ribbon representation. DNA is colored as follows: cyan, CAP-DNA; blue, CAP-[6A;17T]DNA; yellow, CAP-[6G;17C]DNA; red, CAP-[6C;17G]DNA. The figure was generated using PyMol (http://pymol.sourceforge.net/) and nuccyl (http://www.mssm.edu/students/jovinl02/research/nuccyl.html).
