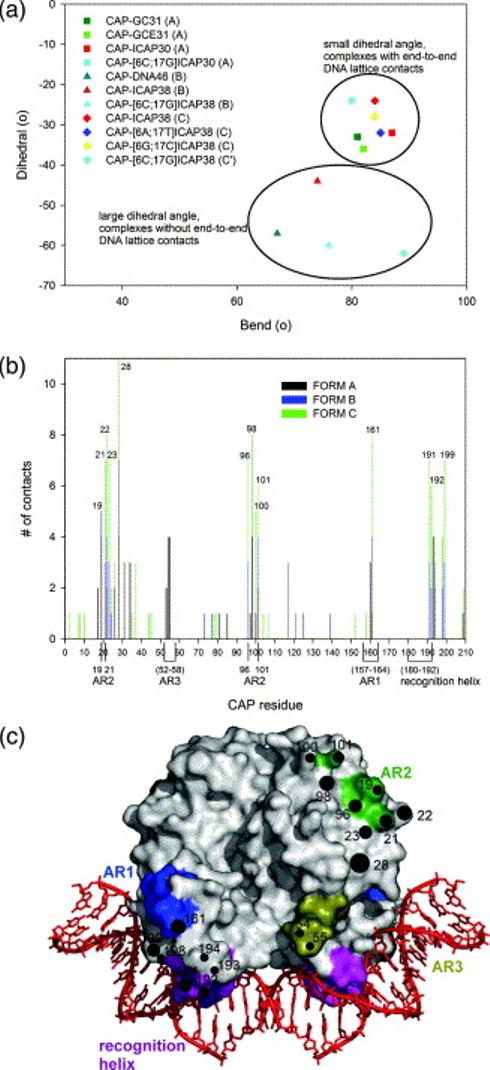
Figure 5.

Analysis of crystal structures of wild-type CAP-DNA complexes herein and in the literature. (a) Plot of DNA dihedral angle versus DNA bend angle in crystal structures of wild-type CAP-DNA complexes (squares, crystal form A; triangles, crystal form B; diamonds, crystal form C; circles, crystal form C′). (b) Plot of CAP residue number versus frequency of involvement in crystal-lattice contacts in crystal structures of wild-type CAP-DNA complexes. (c) Surface representation of CAP showing residues involved in crystal-lattice contacts in at least 35% of crystal structures of wild-type CAP-DNA complexes (circles, with higher diameters indicating higher frequencies of involvement in crystal-lattice contacts), DNA recognition helices (magenta), and transcription activating regions 1 (AR1, blue), 2 (AR2, dark green), and 3 (AR3, olive green).
