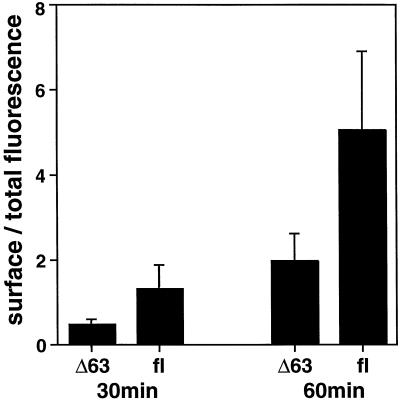
Figure 5.
Quantitation of the appearance of VSV-G on the cell surface. NRK cells expressing VSV-G (ts-O45-G) and Δ63 GM130 or fl GM130 were shifted to the permissive temperature for 30 or 60 min and double labeled for VSV-G on the cell surface and in intracellular structures, as described in Figure 4. Surface and internal fluorescence of the VSV-G protein were quantified, and the ratio of the two signals was determined for each cell analyzed and expressed as the mean ± SD. Note that the ratio of surface fluorescence to total fluorescence is >1 because polyclonal antibodies were used to detect the former and mAbs were used to detect the latter.

