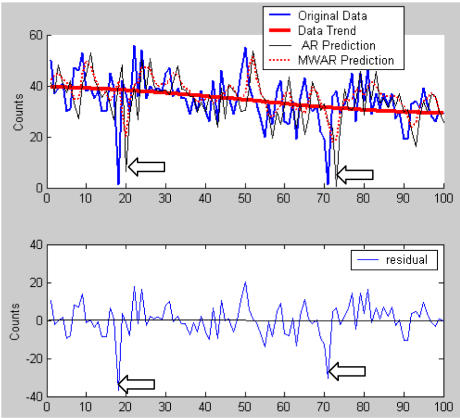
Figure 8.
Subplot 1 illustrates the raw dataset with 2 simulated singularities and the prediction values of AR and MWAR, as well as the trend generated by wavelet decomposition. The following days of negative singularities do not present a significant high value in residual data, which is presented in subplot 2, while the prediction values of these days, obtained from AR and MWAR, exceed the monitor value quit a lot.

