
Figure 2.
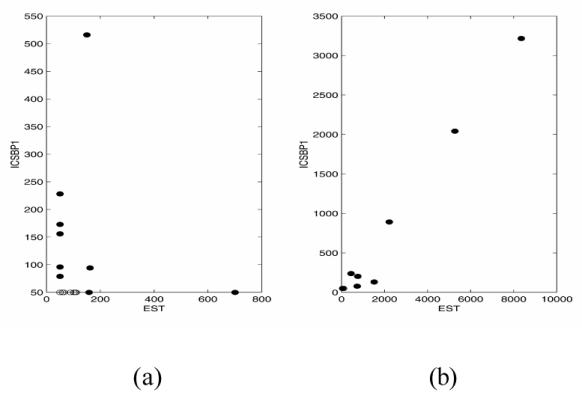
Scatterplot of gene pairs ICSBP1 and an EST using Pearson correlation coefficient. (a) Cancer samples and (b) Normal samples. Notice that the correlation is almost 1 in the Normal group.
Official websites use .gov
A
.gov website belongs to an official
government organization in the United States.
Secure .gov websites use HTTPS
A lock (
) or https:// means you've safely
connected to the .gov website. Share sensitive
information only on official, secure websites.
Scatterplot of gene pairs ICSBP1 and an EST using Pearson correlation coefficient. (a) Cancer samples and (b) Normal samples. Notice that the correlation is almost 1 in the Normal group.