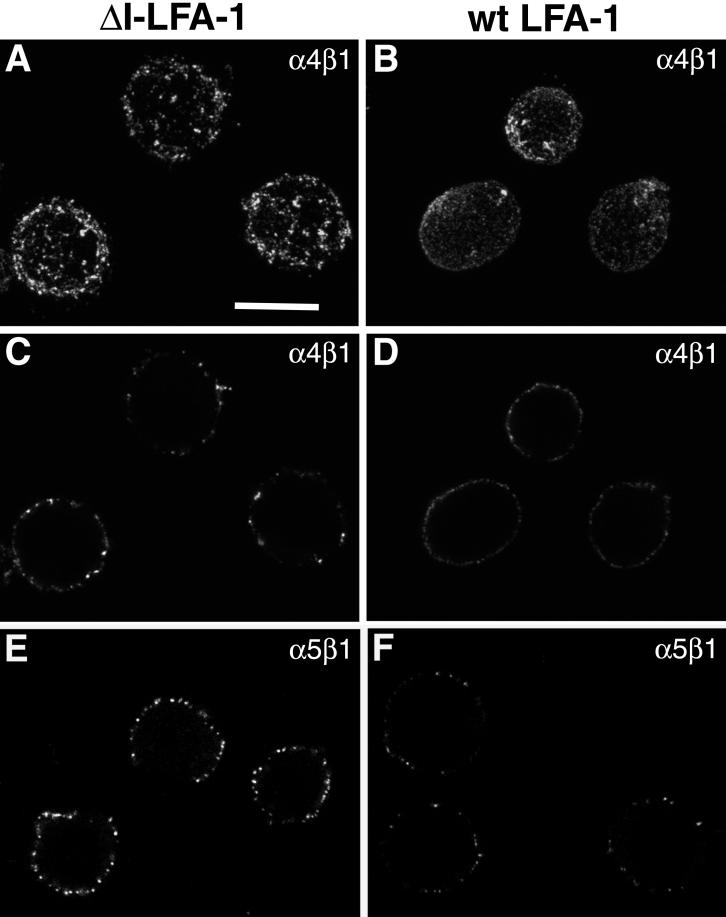
Figure 8.
Distribution of α4β1 and α5β1 on J-β2.7 cells expressing ΔI-LFA-1 or wt LFA-1 as determined by confocal microscopy. Cells were stained on ice with the anti-α4 mAb 7.2R (A–D) or the anti-α5 mAb SAM-1 (E and F), fixed, and incubated with Alexa 488-conjugated goat anti-mouse IgG, followed by confocal microscopy. (A and B) Projections onto the x–y plane of all individual optical sections taken along the z-axis using maximum fluorescence values. (C–F) One optical section taken at midheight of the cells. Data are representative of four experiments (A–D) and five experiments (E and F). Bar, 10 μm.

